Data Simulation Project - simulating a dataset using numpy.random
A Data Simulation Project using numpy.random
In this project I simulated the World Happiness Score, in particular the main determinants of happiness at country levels across the world as reported in the World Happiness Report. The aim of the World Happiness report is to see what countries or regions rank the highest in overall happiness and each of the six factors contributing to happiness.
This post provides an overview of the Simulation project completed for the Programming for Data Analysis module as part of the Higher Diploma in Computing and Data Analytics. This was the second project in this module.
The aim was to create a data set by simulating a real-world phenomenon of our choosing. Then, rather than collect data related to the phenomenon, to model and synthesise such data using Python’s numpy.random package.
Introduction and project overview
The objective of the project is to create a data set by simulating a real-world phenomenon of your choosing…
How to download and run the project
An overview of the project is provided in this post. The project can be cloned or downloaded from the project repository. Instructions on how to download and run the code…
The full project itself including datasets used is available at GitHub.com. The Jupyter notebook itself is quite long and might take some time to load. A rendered version of the notebook can be viewed on https://nbviewer.jupyter.org. An HTML version of the notebook is included with this post and can be viewed here. This contains the Python code, output, explanations etc.
Choose a real-world phenomenon that can be measured and for which you could collect at least one-hundred data points across at least four different variables.
The real-world phenomenon I chose to simulate for this project was the World Happiness Score, in particular the main determinants of happiness at country levels across the world as reported in the World Happiness Report. The aim of the World Happiness report is to see what countries or regions rank the highest in overall happiness and each of the six factors contributing to happiness. Over the years the reports looked at how country ranks and scores changed and whether any country experienced a significant increase or decrease in happiness.
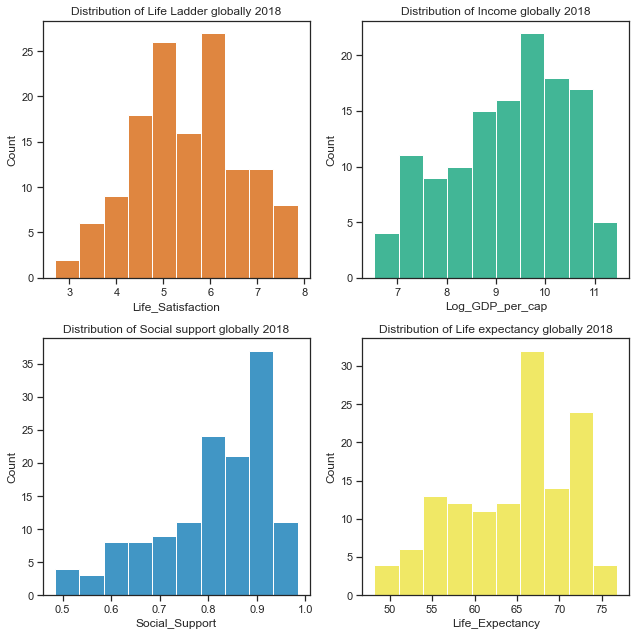
The variables on which the national and international happiness scores are calculated are very real and quantifiable. These include socio-economic indicators such as Gross Domestic Product (GDP), life expectancy as well as some life evaluation questions regarding freedom, perception of corruption, family or social support.
Differences in social support, incomes and healthy life expectancy are the three most important factors in determining the overall happiness score according to the World Happiness Reports.
I first analysed an actual dataset for the phenomenon of World Happiness in order to understand the type of variables and the type of distributions they were likely to have come from and also to see how they were related to each other.
I then simulated the dataset, mainly using the numpy.random package but exploring some functionality from the scikit-learn package.
Finally I compared the results of the simulation to a real world dataset.
I believe the synthesised dataset closely matched the actual dataset. The results of the simulation will change each time the code is run as the random seed is not set. In reality data samples would also vary from sample to sample due to randomness. A random seed can be set to ensure the same data is simulated each time.
The dataset was a little more complicated that it first appeared to be, given the regional variation and also variation within regions. Given that the number of datapoints for a dataset such as this is limited, the number of datapoints that could be simulated is limited but I am satisfied with the results. Overall this project was a very good learning experience.
It was also very eye-opening to see the levels of inequality across the globe.
The researchers studied how 6 different factors contribute to the happiness scores and the extent of each effect.
These are economic production, social support, life expectancy, freedom, absence of corruption, and generosity. They looked at how these factors contribute to making life evaluations higher in each country than they are in Dystopia, a hypothetical country that has values equal to the world’s lowest national averages for each of the six factors.
While these factors have no impact on the total score reported for each country, they were analysed to explain why some countries rank higher than others.
These factors describe the extent to which these factors contribute in evaluating the happiness in each country.
About data Simulation
The goad of this project was to simulate a dataset. Simulating data is used for a number of reasons. Monte carlo simulations are used to simulate real world problems using repeated random sampling while simulated data is very useful for learning and demonstration purposes. Data can be simulated before the real world data is collected to help identify the type of tests and programs that need to be run.
Collecting data requires resources of time and money whereas data can be simulated easily using computer programs. Read more here
The goad of this project is to simulate a dataset. Simulating data is used for a number of reasons. Monte carlo simulation are used to simulate real world problems using repeated random sampling while simulated data is very useful for learning and demonstration purposes. Data can be simulated before the real world data is collected to help identify the type of tests and programs that need to be run. Collecting data requires resources of time and money whereas data can be simulated easily using computer programs.
Statistical analysis can be performed on the simulated data in advance of collecting the real data this process can be repeated as many times as needed. By studying simulated data you can become more familiar with the different kinds of data distributions and be in a better position to make decisions about the data and what to do with it such as how to measure it and how much is required. Simulations produce multiple sample outcomes. Experiments can be run by modifying inputs and seeing how this changes the output. The process of generating a random sample can be repeated many many times which will allow you to see how often you would expect to get the outcomes you get. Repeating the process gives multiple outcomes which can then be averaged across all simulations.
Read more on simulation
Data used in this project
The World Happines Report is produced by the United Nations Sustainable Development Solutions Network in partnership with the Ernesto Illy Foundation. The first World Happiness Report was published in 2012, the latest in 2019. The World Happiness Report is a landmark survey of the state of global happiness that ranks 156 countries by how happy their citizens perceive themselves to be. Each year the report has focused in on a different aspect of the report such as how the new science of happiness explains personal and national variations in happiness and how well-being is a critical component of how the world measures its economic and social development. Over the years it looked at changes in happiness levels in the countries studies and the underlying reasons, the measurement and consequences of inequality in the distribution of well-being among countries and regions. The 2017 report emphasized the importance of the social foundations of happiness while the 2018 report focused on migration. The latest World Happiness Report (2019) focused on happiness and the community and happiness has evolved over the past dozen years. It focused on the technologies, social norms, conflicts and government policies that have driven those changes.
Read more here