This is perhaps the best known database to be found in the pattern recognition literature. Fisher’s paper is a classic in the field and is referenced frequently to this day. - UCI Machine Learning Repository
The Iris Data Set is available from The UCI Machine Learning Repository which has a wide collection of databases used by the machine learning community for the empirical analysis of machine learning algorithms.
According to UCI Machine Learning Repository, the Iris dataset is widely used in pattern recognition learning. One class is linearly separable from the other two classes, which are not linearly separable from each other. The predicted attribute of the data set is the class of Iris plant to which each observation belongs.
The Iris dataset is a multivariate dataset with a default machine learning task of classification. It consists of 150 instances with five attributes, with four of these being the measurements of the sepal and petals of each observation in the data set and the fifth being the class or species of Iris that each observation belongs to. It includes 50 plants each of three classes of Iris plant, where each class is a different type or species of Iris plant. The three classes in the data set are the Iris Setosa, the Iris Versicolor and the Iris Virginica. The data set was donated in 1988 by Michael Marshall but the data set was created by R.A. Fisher in 1936.
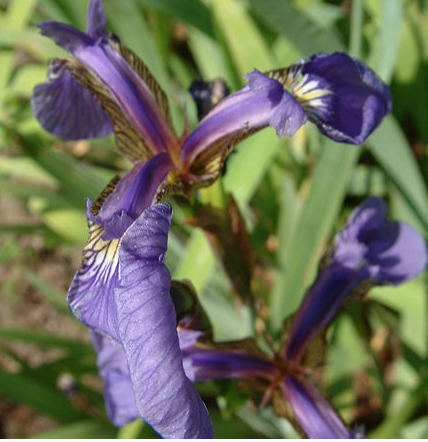 Iris-Setosa |
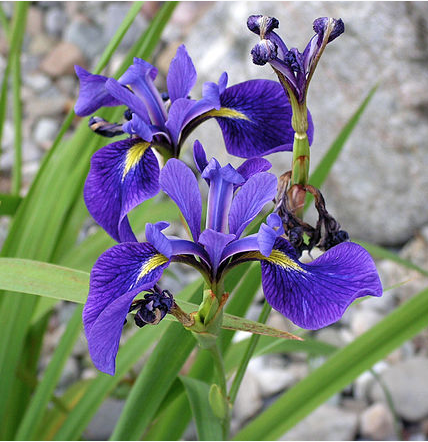 Iris-Versicolor |
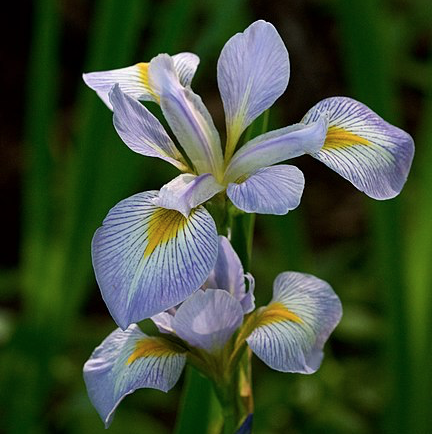 Iris-Virginica |
|---|
The following attribute information is provided along with the data set on the UCI Archive page.
Attribute Information:
- Sepal length in cm
- Sepal width in cm
- Petal length in cm
- Petal width in cm
- Class / Species:
- Iris Setosa
- Iris Versicolor
- Iris Virginica
Much of the information about the Iris dataset in this section is primarily gathered from following the web links at the Iris flower data set wikipedia wiki and the UCI Machine Learning Repository - Iris Data Set pages which both provide references to the works by R.A. Fisher and Edgar Anderson.
Sir Ronald Aylmer Fisher (17 February 1890 – 29 July 1962) was a British statistician and geneticist. For his work in statistics, he has been described as “a genius who almost single-handedly created the foundations for modern statistical science” and “the single most important figure in 20th century statistics”.
In 1936 Fisher introduced the Iris flower data set as an example of discriminant analysis which he proposed as a method to predict qualitative values. He used it to distinguish the different species of Iris flowers from each other using the combination of the four measurement variables in the data set.
According to The Use of Multiple Measurements in Taxonomic Problems by R.A Fisher When two or more populations have been measured in several characters, xl, …,x8, special interest attaches to certain linear functions of the measurements by which the populations are best discriminated.
Fisher considered the question of what linear function of the four measurements would maximise the ratio of the difference between the specific means to the standard deviation between species. Based on the combination of the four measurement features of the sample of plants in the iris datas set, he developed a linear discriminant model to discriminate or distinguish the Iris species from each other.
Discriminant analysis is a statistical classification method used when the dependent variable is categorical. Discriminant analysis looks for the best linear combination of independent variables that will discriminate between the categories of the dependent variables and to see if significant differences exists among the groups of predictor variables. It is a popular technique in statistics when there are more than two responses classes and is considered more stable than logistic regression (another popular statistical method for classifying qualitative or categorical variables) when the predictor classes are well separated. The distribution of the predictor variables are modelled separately in each of the response classes or dependent variables.
According to the Iris Flower Data Set Wikipedia page: Based on Fisher’s linear discriminant model, this data set became a typical test case for many statistical classification techniques in machine learning such as support vector machines.
Fisher also developed the ANOVA method (Analysis of Variance) which he used to analyse data from crop experiments. He pioneered the principles of the design of experiments and the statistics of small samples and the analysis of real data.
While Fisher used the Iris data set as an example to demonstrate statistical methods of classification, the Iris data itself was actually collected by Edgar Anderson, an American botanist and geneticist. Fishers’s Iris data set is therefore often known as Anderson’s Iris data set.
Edgar Anderson was particularly interested in the variation in plant species or a group of species, and in evolution in general. Anderson is known for his work in the genetics of hybridization and character variation measurement.
Andersons’s interest in the iris plants was for morphological reasons and he was trying to find out how one species of Iris could have evolved from another species.
http://people.wku.edu/charles.smith/chronob/ANDE1897.htm
According to a biolographical memoir on Edgar Anderson, written by a fellow botanist G. Ledyard Stebbins, Anderson carried out research in the 1920’s that focused on developing techniques to quantify geographic variation in Iris versicolor. In this memoir, Leyard describes how Anderson had observed that there was a lot of genetic variation within most populations of plants and set out to find a few easily recognisable, well-differentiated species to research. Anderson chose the Iris Versicolor as he had previously believed it to be a clearly defined species. However he subsequently discovered that it was actually two species which he could tell apart after some preliminary analysis. Anderson then set out to find how one species could have evolved from another and collected a very large samples of iris flowers to analyse. This led had to seek a third species that could be a possible alternate parent for one of the two species that he was studying. The course of his research led him to the Iris Setosa, a species native to Alaska. His research indicated that the Iris Versicolor of northeastern North America had arisen as an amphiploid, one parent being Iris Virginica of the Mississippi Valley and the Southeast Coast and the other being the Iris Setosa of the Yukon Valley Alaska.
Anderson carefully examined the individual characters of the iris plants that were growing in different conditions. He used scatter diagrams and ideographs - simplified diagrams which he developed himself - so that he could visualise and compare the data more easily. These methods helped him to come to conclusions about the data.
Anderson did further study on the genus Iris in the 1930’s looking at the complex variation patterns of populations found in the Mississippi delta region. From further study he showed that while the variation with respect to leaves, stems and other vegetative characteristics of the plant was due largely to phenotypic modification, the reproductive characteristics (the flower including petals and sepals) were remarkably constant for a genotype and exhibited a large amount of genotypic variation within populations. Biographical Memoir of Edgar Anderson by G Ledyard Stebbins
In the 1936 Iris data set, the two species Iris Setosa and Iris Versicolor were found growing together in the same colony in the Gaspé Pensinsula in Canada. The sample of the third species - the Iris Virginica differs from the other two samples as they were not taken from the same natural colony.
Fisher used a linear compound of the four measurements and then looked at the means and variations of the compound measurements.
He showed that the differences between the Iris Setosa and the Iris versicolor was so great compared to the standard deviations of the compound measurements while the differences between the Iris Virginica and the Iris Versicolor was less than four times the standard deviation of each species.
Fisher concluded that there as there is some overlap between the distributions of the Iris Virginica and the Iris Versicolor and therefore they are not as easily distinguished from one another based solely on the four measurements.
It will be noticed, as was anticipated above, that there is some overlap of the distributions of I. Virginica and I. versicolor, so that a certain diagnosis of these two species could not be based solely on these four measurements of a single flower taken on a plant growing wild. It is not, however, impossible that in culture the measurements alone should afford a more complete discrimination.
The Iris data set and machine learning
The Iris dataset appears in many text books and tutorials related to statistical and machine learning. Statistical learning is a set of tools for modelling and understanding complex data sets. Machine learning is about learning from data and while it is often associated with artificial intelligence, it is also used in areas such as image and voice recognition, natural language processing and many other areas. Machine learning is about learning some properties of a data set and then testing those properties against another data set.
scikit-learn is a machine learning package in python that actually uses the Iris dataset in its demonstrations. Scikit- learn provides some information about machine learning and outlines how in general a machine learning problem considers a set of n samples of data and then tries to predict properties of unknown data. If each sample is more than a single number and, for instance, a multi-dimensional entry (aka multivariate data), it is said to have several attributes or features.
The Iris data set is a relatively small multi-variate data set containing of only 150 rows and 5 fields or variables in columns. Each observation in the Iris data set consists of a four dimensional array of numerical measurements and a single categorical class of iris species to which it belongs and represents one instance of an iris plant or flower.
Machine learning uses some algorithm or other to solve the classification or prediction problem. An algorithm takes inputs and produces some outputs. The machine learning task that is generally applied to the Iris data set is classification. A classification algorithm applied to the Iris data set might take in the features of some observations and output the class to which the observation is more likely to belong to. The objective of classification would be to classify or predict the class label of a new instance of an Iris flower (from outside the data set) to the class or species to which it belongs. Each of the rows in the Iris dataset is an observation or a data point while each column holds a variable or feature. The Iris dataset contains more than two possible classes and therefore is considered a multi-class classification problem.
Each observation in the Iris data set represents one instance of an iris plant or flower. Each observation belongs to one class of three possible classes and these labels are provided in the data set. This is an example of supervised learning where the data comes with additional attributes that we want to predict. Supervised learning can be either a classification problem where the
samples belong to two or more classes and we learn from already labeled data how to predict the class of the unlabeled data or a regression problem where the desired output consists of one or more continuous variables.
There are many tools or algorithms in supervised learning that can be used to predict an outcome from a data set such as logistic regression, linear discriminant analysis, classification trees, support vector machines and many more.
Some classification algorithms are based on nearest neighbour, where an observation might be assigned to a class based on its proximity to another observation.
In Unsupervised learning, the training data consists of a set of inputs without any corresponding target values or labels. One of the goals of unsupervised learning is to discover groups or clusters of similar examples within the data. It is also used to determine the distribution of data within the input space, known as density estimation, or to project the data from a high-dimensional space down to two or three dimensions for the purpose of visualization.
Unsupervised learning tends to be more subjective as there is no simple goal for the analysis, such as prediction of a response. Unsupervised learning is often performed as part of an exploratory data analysis. While it is possible to check results from supervised learning and to see how well a model predicts the response variable on observations not included in fitting the model, this is not the case in unsupervised learning and it is not so clear how to assess the results obtained compared to supervised learning.
At a quick first glance, the Iris flowers would seem quite similar and hard to tell apart. However a closer look at the overall plant’s description including features such as plant height and leaf type as well as colour, would make them seem a bit easier to distinguish from each other which makes me wonder why only the petal and sepal measurements of the flower are used and not other features of the plants.
However, as experts in their fields, Fisher and Anderson looked specifically at the petal and sepal measurements, or more specifically a compound measurement of these variables as a way to classify the Iris plants which shows how important it is in machine learning to have some background knowledge of the data from an expert in a field, such as the biologists and botanists Fisher and Anderson in the case of the Iris data set.
The Fisher Iris data set is still widely used in learning classification methods.