For this project, I mainly worked through the Python documentation manuals of the Pandas, Matplotlib and Seaborn modules as well as the Python 3 documentation. There are many resources freely available for learning how to use Python and applying it to analysing datasets such as the Iris dataset. The pandas library is quite intuitive and in a valuable tool in investigating and analysing multi-class multi-variates datasets such as the Iris dataset.
I looked at the statistical properties of the Iris data set in this project. Visualising the data gives a better understanding of the data and what can be done with it. It demonstrates some of the properties of the dataset which Fisher used in developing his linear discriminant model.
The Iris data set is referenced quite a bit in machine learning and many resources on the internet use it to demonstrate their product or to teach machine learning methods. Kaggle hosts the Iris dataset and there are many demonstrations of various machine learning algorithms using the Iris dataset from many people.
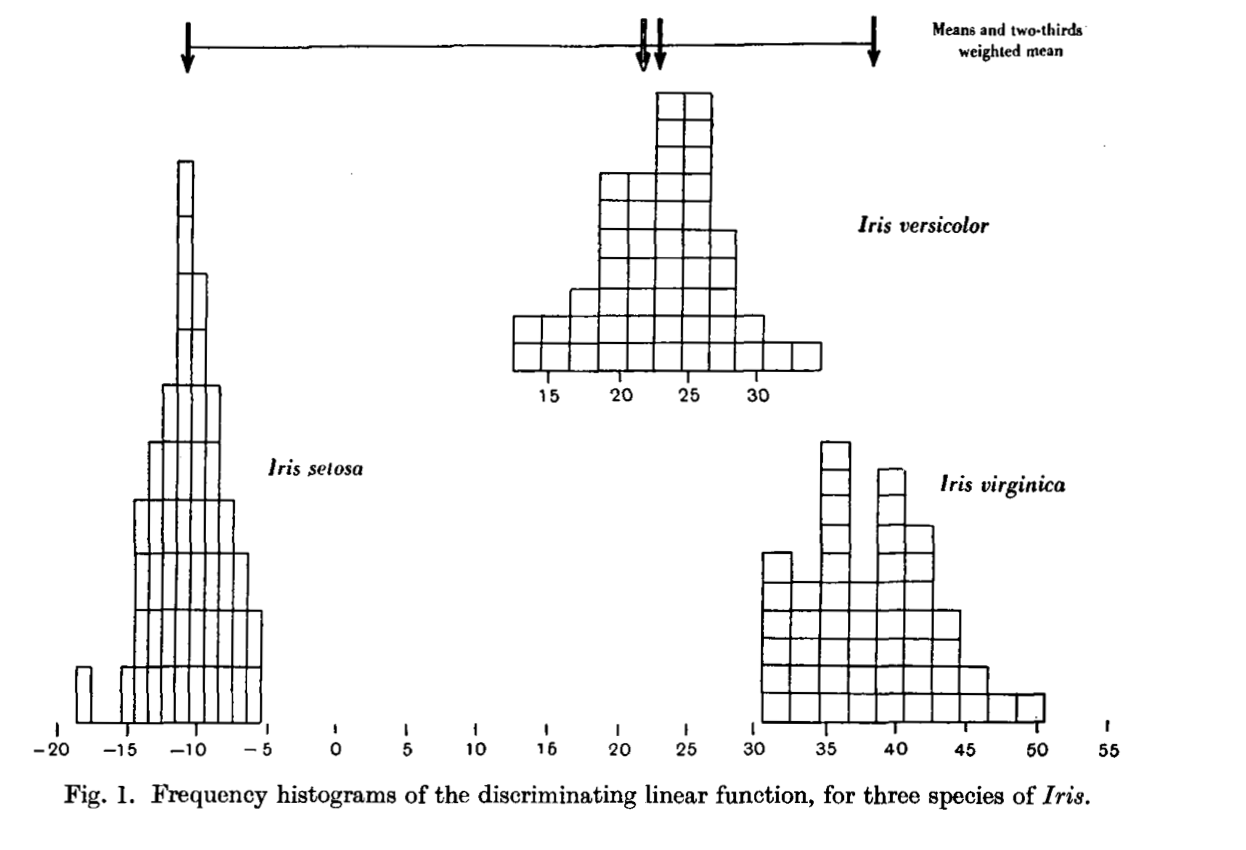
Much of modern statistical and machine learning is based upon the work of R.A Fisher in the 20th century and he is often referred to as the father of modern statistics. Fisher developed the linear discriminant model based on the combination of the four measurement features in the Iris dataset. The dataset became a test case for classification methods in the machine learning and the pattern recognition field because one class of the three Iris species in the data set is linearly separable from the other two classes while the other two classes are not linearly separable from each other.
The pairwise grid of scatter plots shows how the Iris Setosa is clearly different in these features compared to the other two species. The plots also show how it is not so simple to separate to separate the other two classes from each other as there is a bit of overlap. This corresponds with Fisher’s conclusions back in 1936.
The Iris dataset is quite small with only 150 observations. It’s observations are also evenly divided into three classes which would indicate that they were probably selected to demonstrate the linear discriminant model, rather than being randomly selected from a larger population of iris flowers. It is useful for practicing and demonstrating classification algorithms and is often called a ‘toy’ dataset.
The statistics generated by the code in the script shows that the average petal length for an Iris Setosa is much smaller than the other two classes. The Iris Virginica has the largest average petal length which is almost four times greater than the petal length of the Iris Setosa. The average petal length for the Iris Versicolor is not very different to that of the Iris Versicolor.
The standard deviations also show that the petal measurements of the Iris Setosa is much less variable than that of the other two species.
The average petal width of the Setosa is also much smaller than the average petal widths of the other two species. In fact the petal width of the Setosa is about twelve times smaller than the petal width of the Virginica. There is less variability in petal widths in all three species though compared to the variability in the petal length.
There is not such a large difference between the sepal lengths of the three Iris species, although the Setosa is again showing the smallest average measurements. The average sepal width of the Setosa however is actually larger than the averages for the other two species but not by a huge amount.
From the summary statistics of the sepal and petal measurements by class type it would appear that the differences between the Iris Setosa and the other two species is more pronounced that any other differences between the three classes.
The following image shows the frequency histogram that Fisher used and while the plots in this project only show distributions for a single measurement variable at a time, it is interesting to see they look familiar!.
Correlation shows whether a linear relationship between variables exists and shows if one variable tends to occur with large or small values of another variable. The scatter plot shows quite a strong positive relationship overall between the petal length and petal width measurements. The relationship between petal length and petal width is not as strong for the Iris Setosa as with the other two species. The correlation matrix showed a strong relationship between sepal length and sepal width for the Iris Setosa only and a strong relationship between the petal length and petal widths for the Iris Versicolor only. However the relationship between the petal lengths and sepal lengths is very strong for the Iris Virginica with Iris Versicolor being only a little bit weaker.